> ## Documentation Index
> Fetch the complete documentation index at: https://cubed3-feat-druid-driver-streaming.mintlify.site/llms.txt
> Use this file to discover all available pages before exploring further.
# Retool
> Retool is the fast way to build internal tools. It lets you visually design apps that interface with any database or API.
[Retool](https://retool.com/) is the fast way to build internal tools. It lets
you visually design apps that interface with any database or API.
Here's a short video guide on how to connect Retool to Cube.
## Connect from Cube Cloud
Navigate to the [Integrations](/admin/connect-to-data/visualization-tools)
page, click **Connect to Cube**, and choose **Retool** to get
detailed instructions.
## Connect from Cube Core
You can connect a Cube deployment to Retool using the [REST (JSON) API](/reference/core-data-apis/rest-api).
## Connecting from Retool
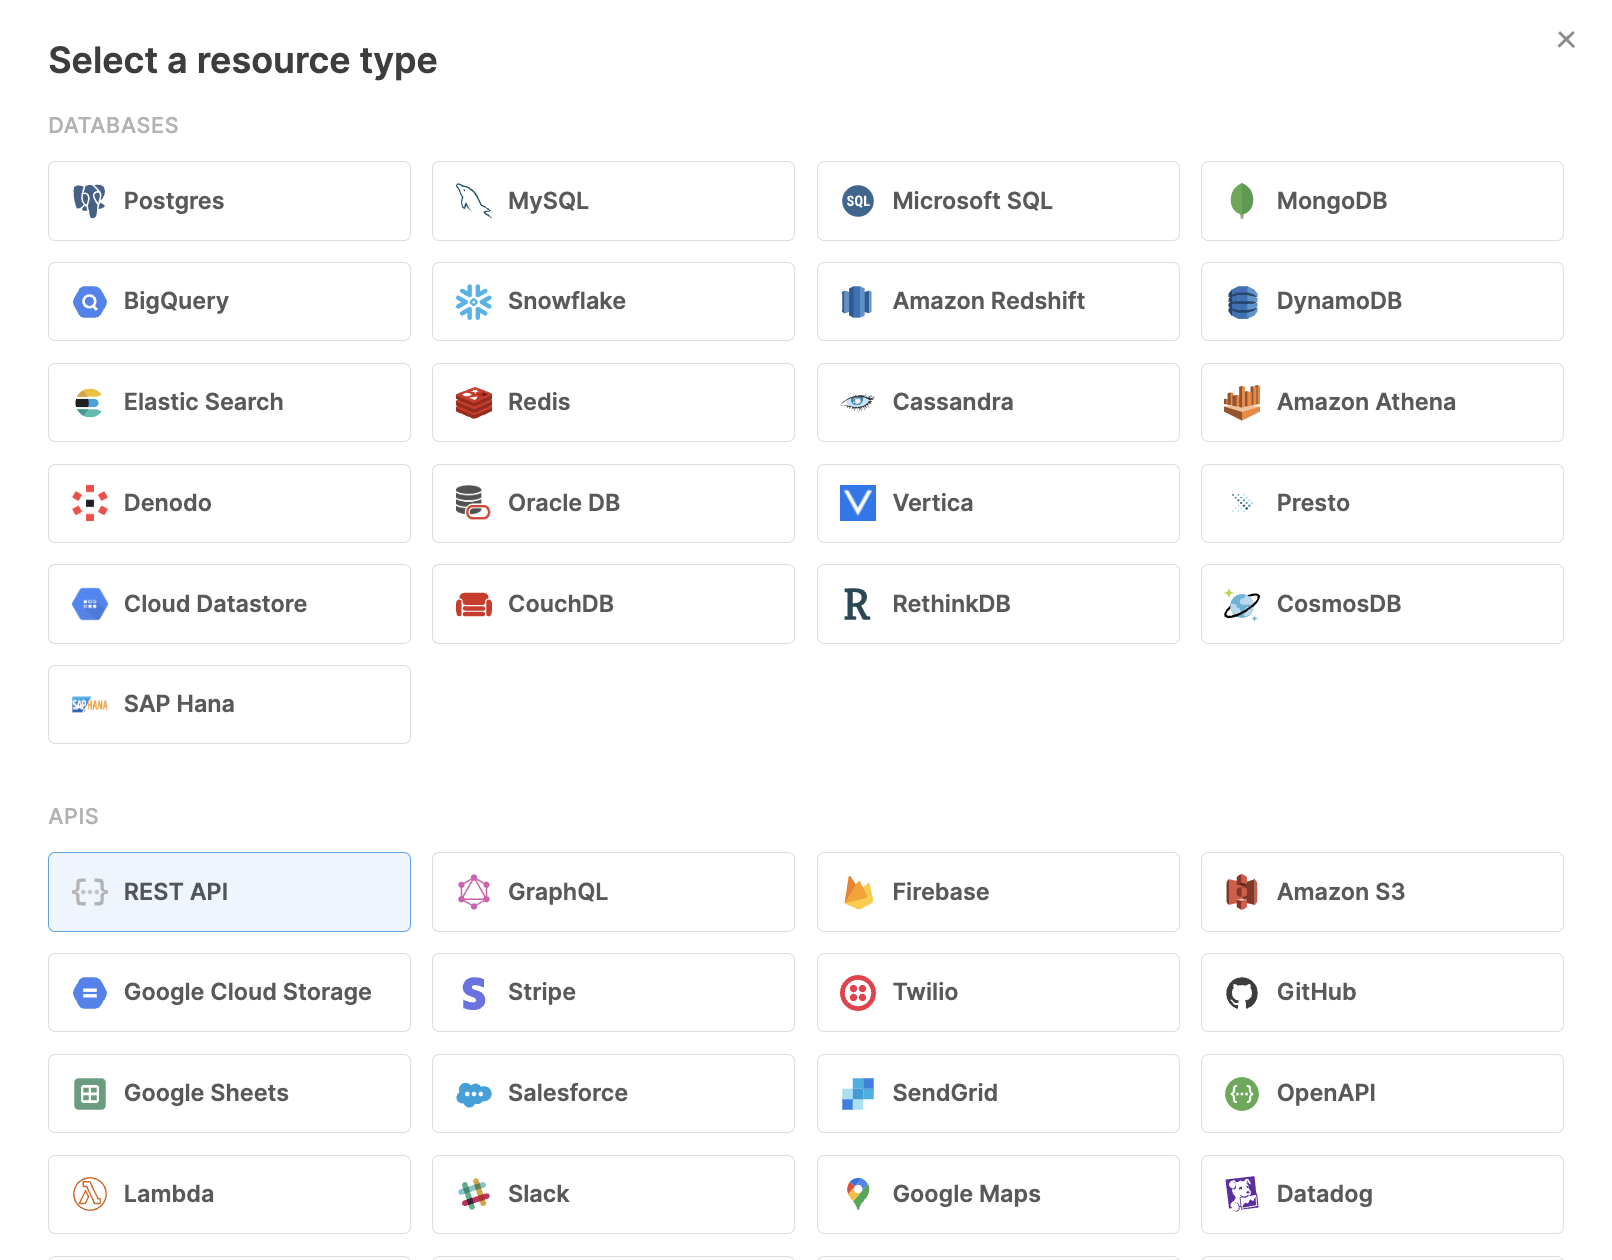
### Create a new resource in Retool
Create a new "REST API" resource in Retool.
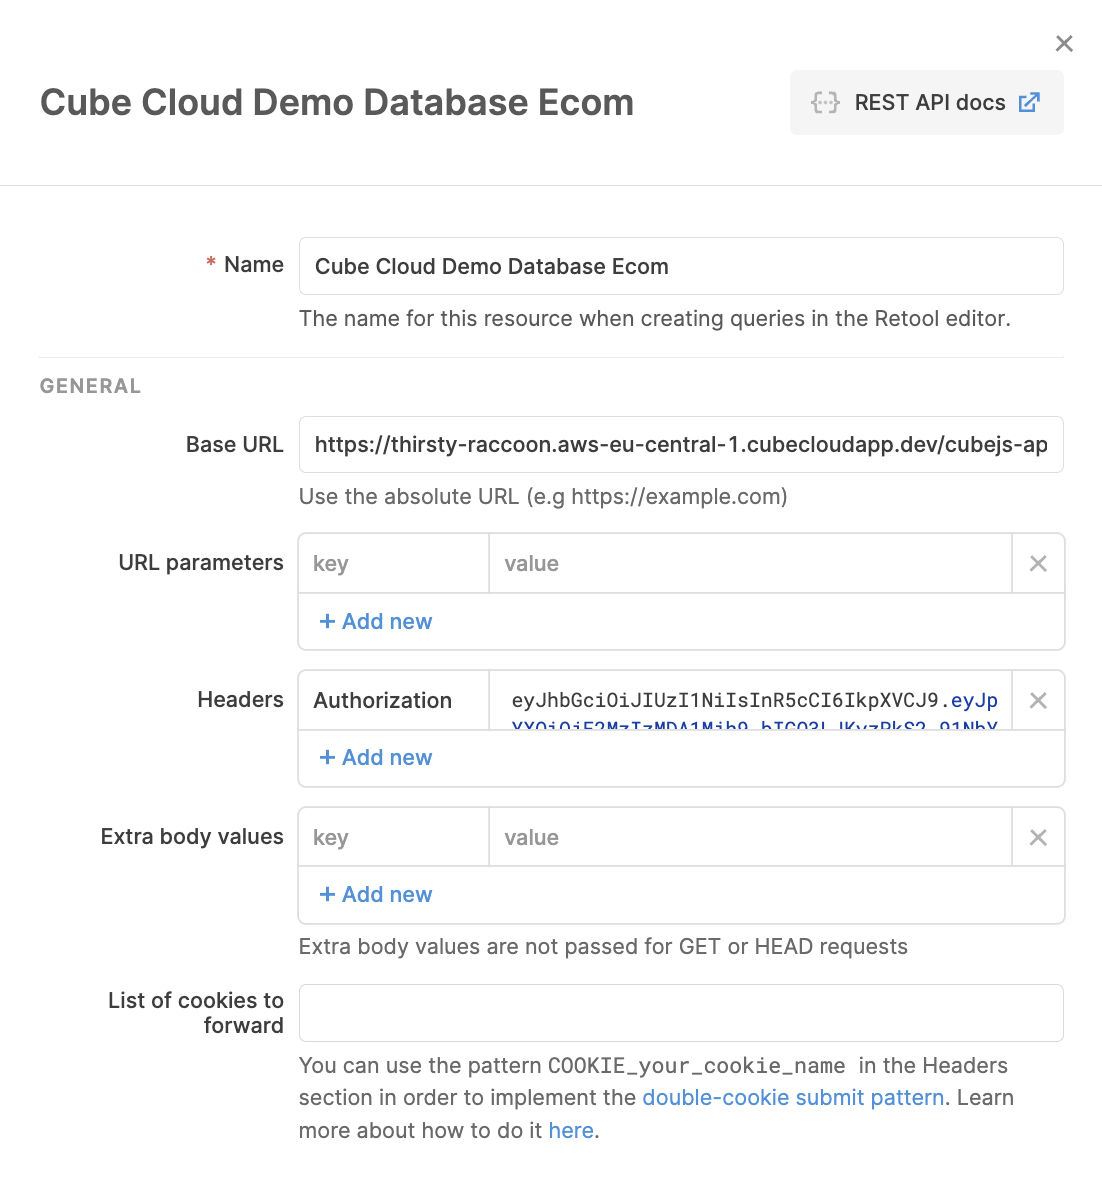
 Next, copy and paste Cube's REST (JSON) API URL and the Authorization token.
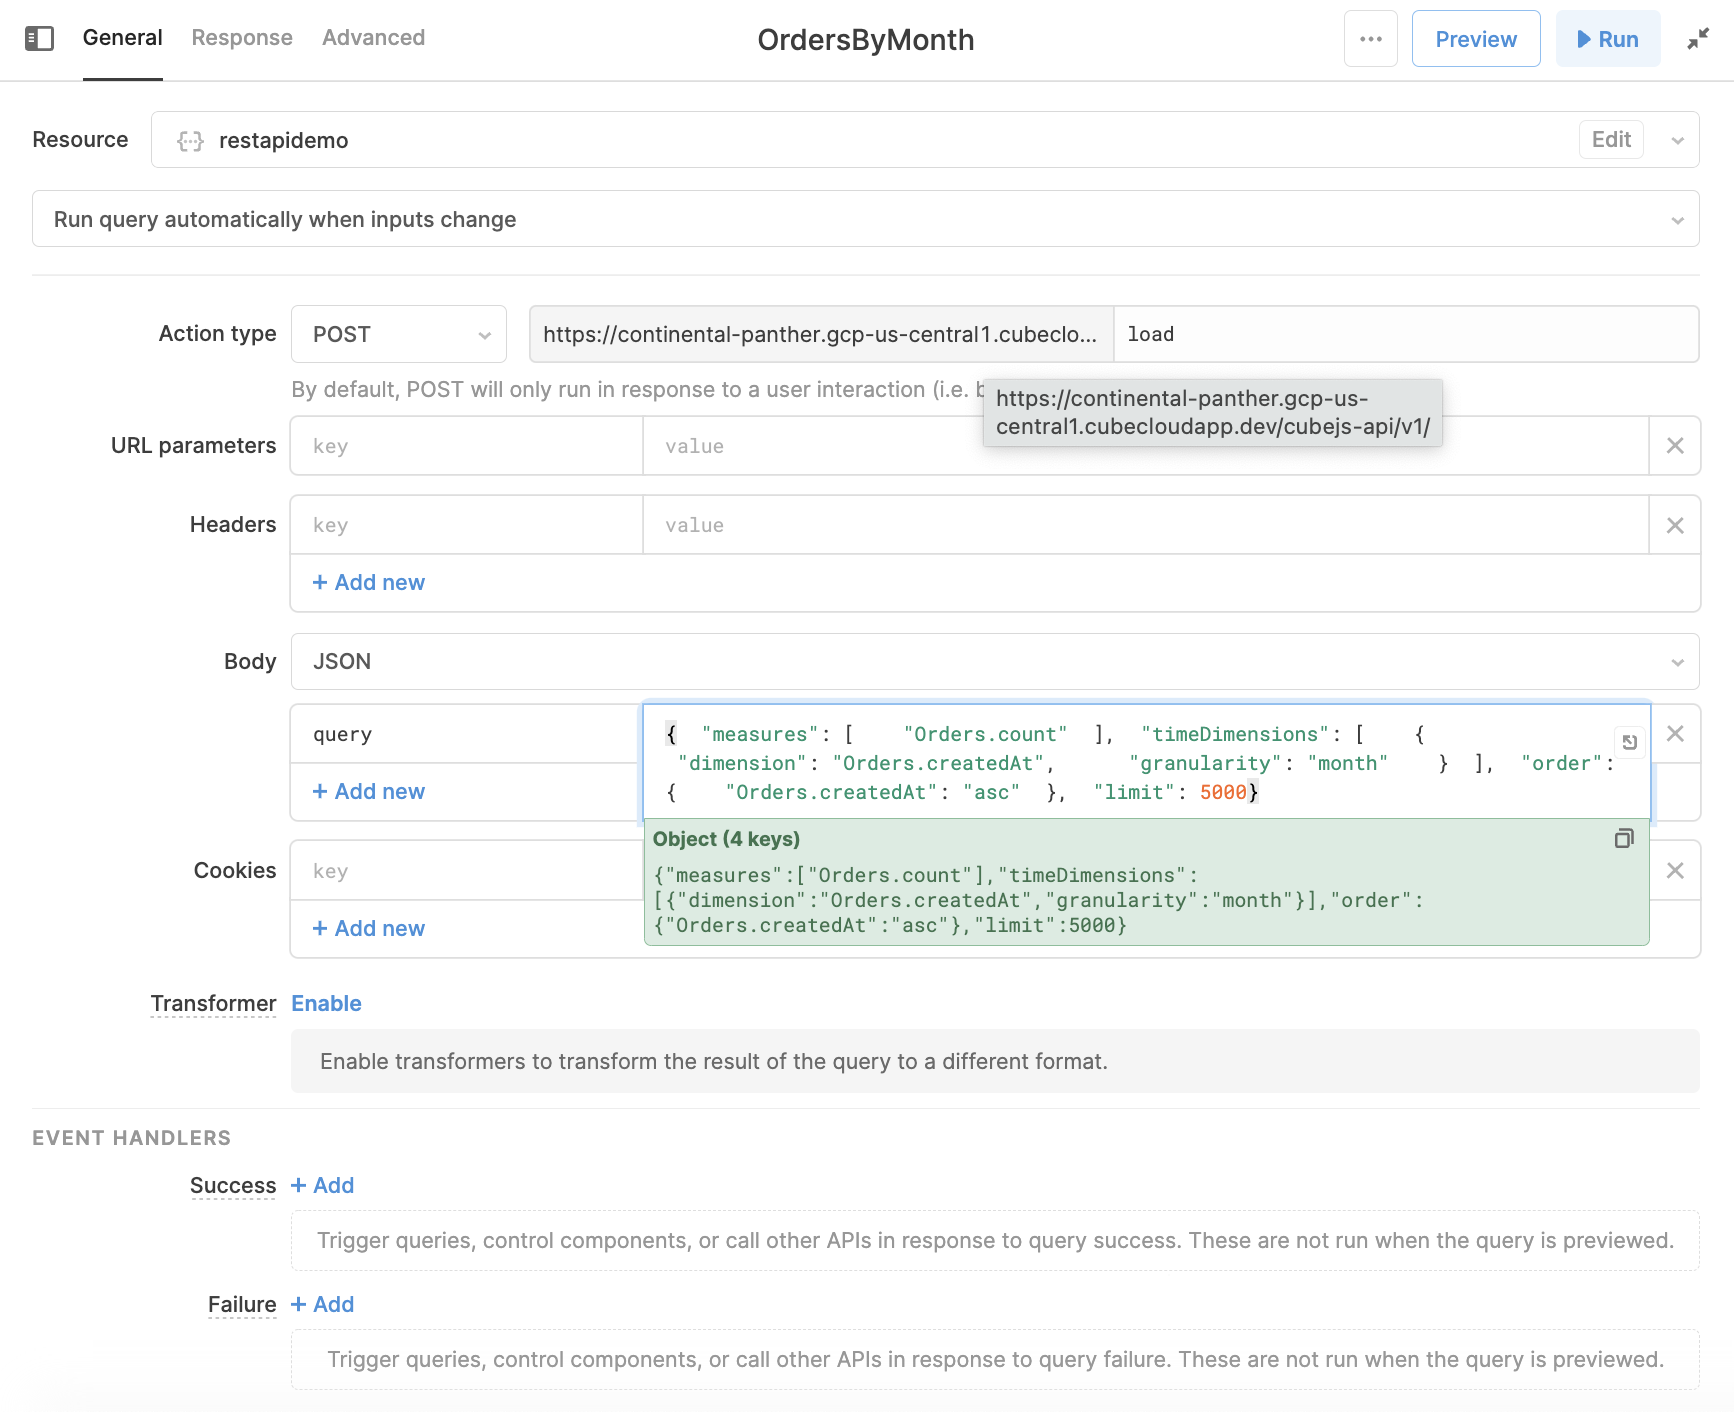
 ### Create a POST request in Retool
Get your Cube query in the JSON
[query format](/reference/core-data-apis/rest-api/query-format) ready. You can
copy it from Cube’s Playground or compose manually.
Create a POST request, paste the JSON query in the **Body**. Make sure to add a
`query` parameter for your JSON query.
Because the Cube REST (JSON) API has the format of `HOST/cubejs-api/v1`, don't forget
to add the `/load` endpoint to the end of the data source API.
Next, hit Run.
### Create a POST request in Retool
Get your Cube query in the JSON
[query format](/reference/core-data-apis/rest-api/query-format) ready. You can
copy it from Cube’s Playground or compose manually.
Create a POST request, paste the JSON query in the **Body**. Make sure to add a
`query` parameter for your JSON query.
Because the Cube REST (JSON) API has the format of `HOST/cubejs-api/v1`, don't forget
to add the `/load` endpoint to the end of the data source API.
Next, hit Run.
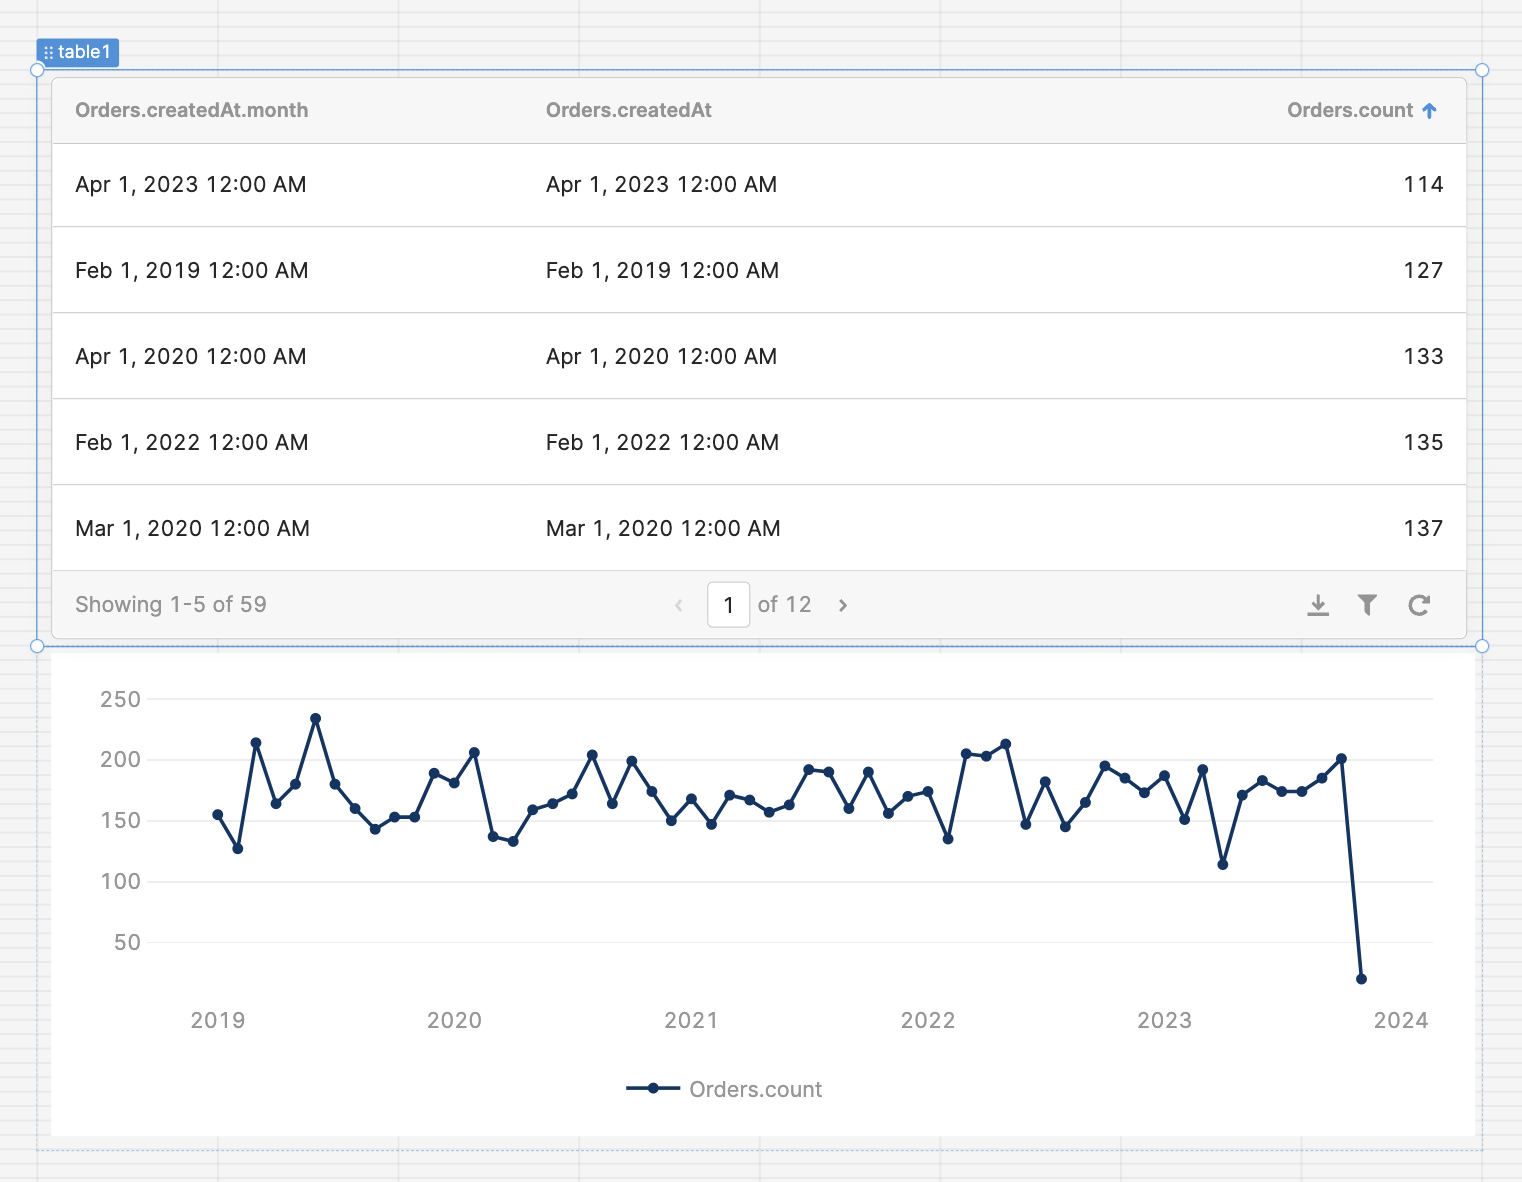
 ### Display the data in Retool
Retool has an amazing feature where you can drag and drop UI components into the
dashboard. You can use this to add a tables, bar charts, and much more.
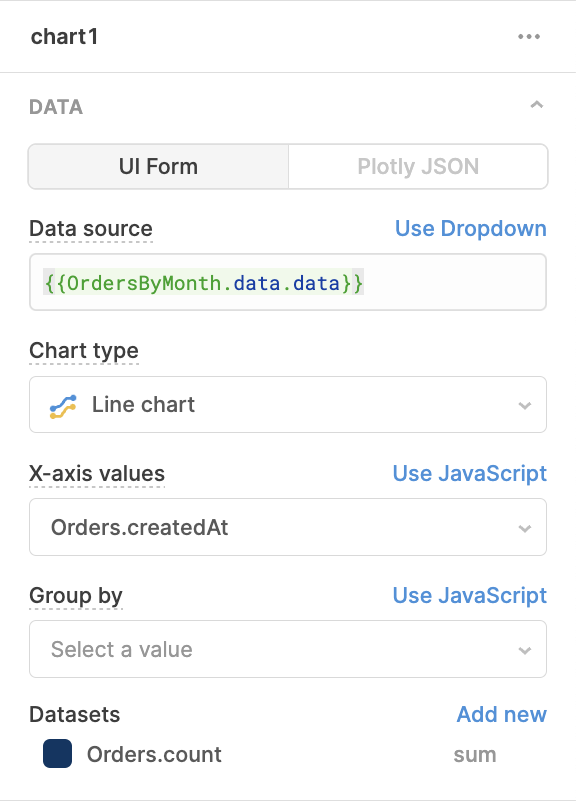
Because the name of the Retool query in the example is `OrdersByMonth`, using
the data binding curly brackets will populate the charts with data from the
REST (JSON) API.
```handlebars theme={null}
{{OrdersByMonth.data.data}}
```
Reference the name of the query in your Retool charts.
### Display the data in Retool
Retool has an amazing feature where you can drag and drop UI components into the
dashboard. You can use this to add a tables, bar charts, and much more.
Because the name of the Retool query in the example is `OrdersByMonth`, using
the data binding curly brackets will populate the charts with data from the
REST (JSON) API.
```handlebars theme={null}
{{OrdersByMonth.data.data}}
```
Reference the name of the query in your Retool charts.
 Get nicely rendered charts.